Location maps allow a more global overview of the study area represented on the main map

The principle is very
simple: these are two maps
in
a
single
setting. The location map will have a
particular feature: we will freeze the area
, the layers displayed and the symbology of these
layers once for all . The only variable will be the area
rectangle which is managed by QGis itself .
To begin, click on the menu Project-> newsettingonpage
or
open
the update manager and create
a
new setting.

In
the layout setting window, add the main map (menu Add an element ->
Add map) and the location map (idem)

Note that while the main map
is
named
map 1 and the one location map 2.
You will start by defining the
location map:
1- in the QGis Mapping window, zoom the window contents to
the desired level in the location map.
2- display only the layers you
want
to see in the location map by
disabling
the
display of the other layers.
3- modify , if necessary , the visible
layers symbology. For example, the thickness of
the lines is generally thinner for the
location map than for the main map .
4-check in the layout setting
manager that
the result matches your what you aim for.
To
do that , having selected Map 2, you have to click
UpdatePreview in
the Main Properties panel.

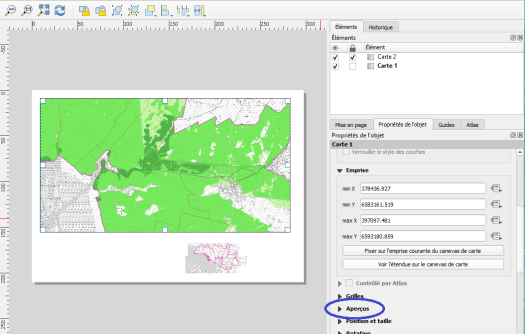
In
the layers
panel, select the Locklayers box and
Lockthe layersstyle.
To
ensure that there will be no other changes, check the map 2 lock box in the Elements
window

Your location map is formatted.
Now you are going to take care of the main map by formatting it (zoom, symbology , etc …)
Once completed the main map formatting,
you only have to connect both maps in a way that the
location map to displays the area of your main map .
To do that you have to unlock map 2, click to select
it , open the Previews panel of your location map.
Click the + button to
add a
preview
in
the list. It will be named
Overview 1.

To
set the preview,
you have to indicate which area it must
show
. In Map frame , select
Map 1

You can change the style ( color
, outline, etc. ) by opening the Frame Style

From that point on, if you
change
the
area of the main map , the extent displayed on the location map
will be modified automatically.